Are major destructive riots in France accelerating?
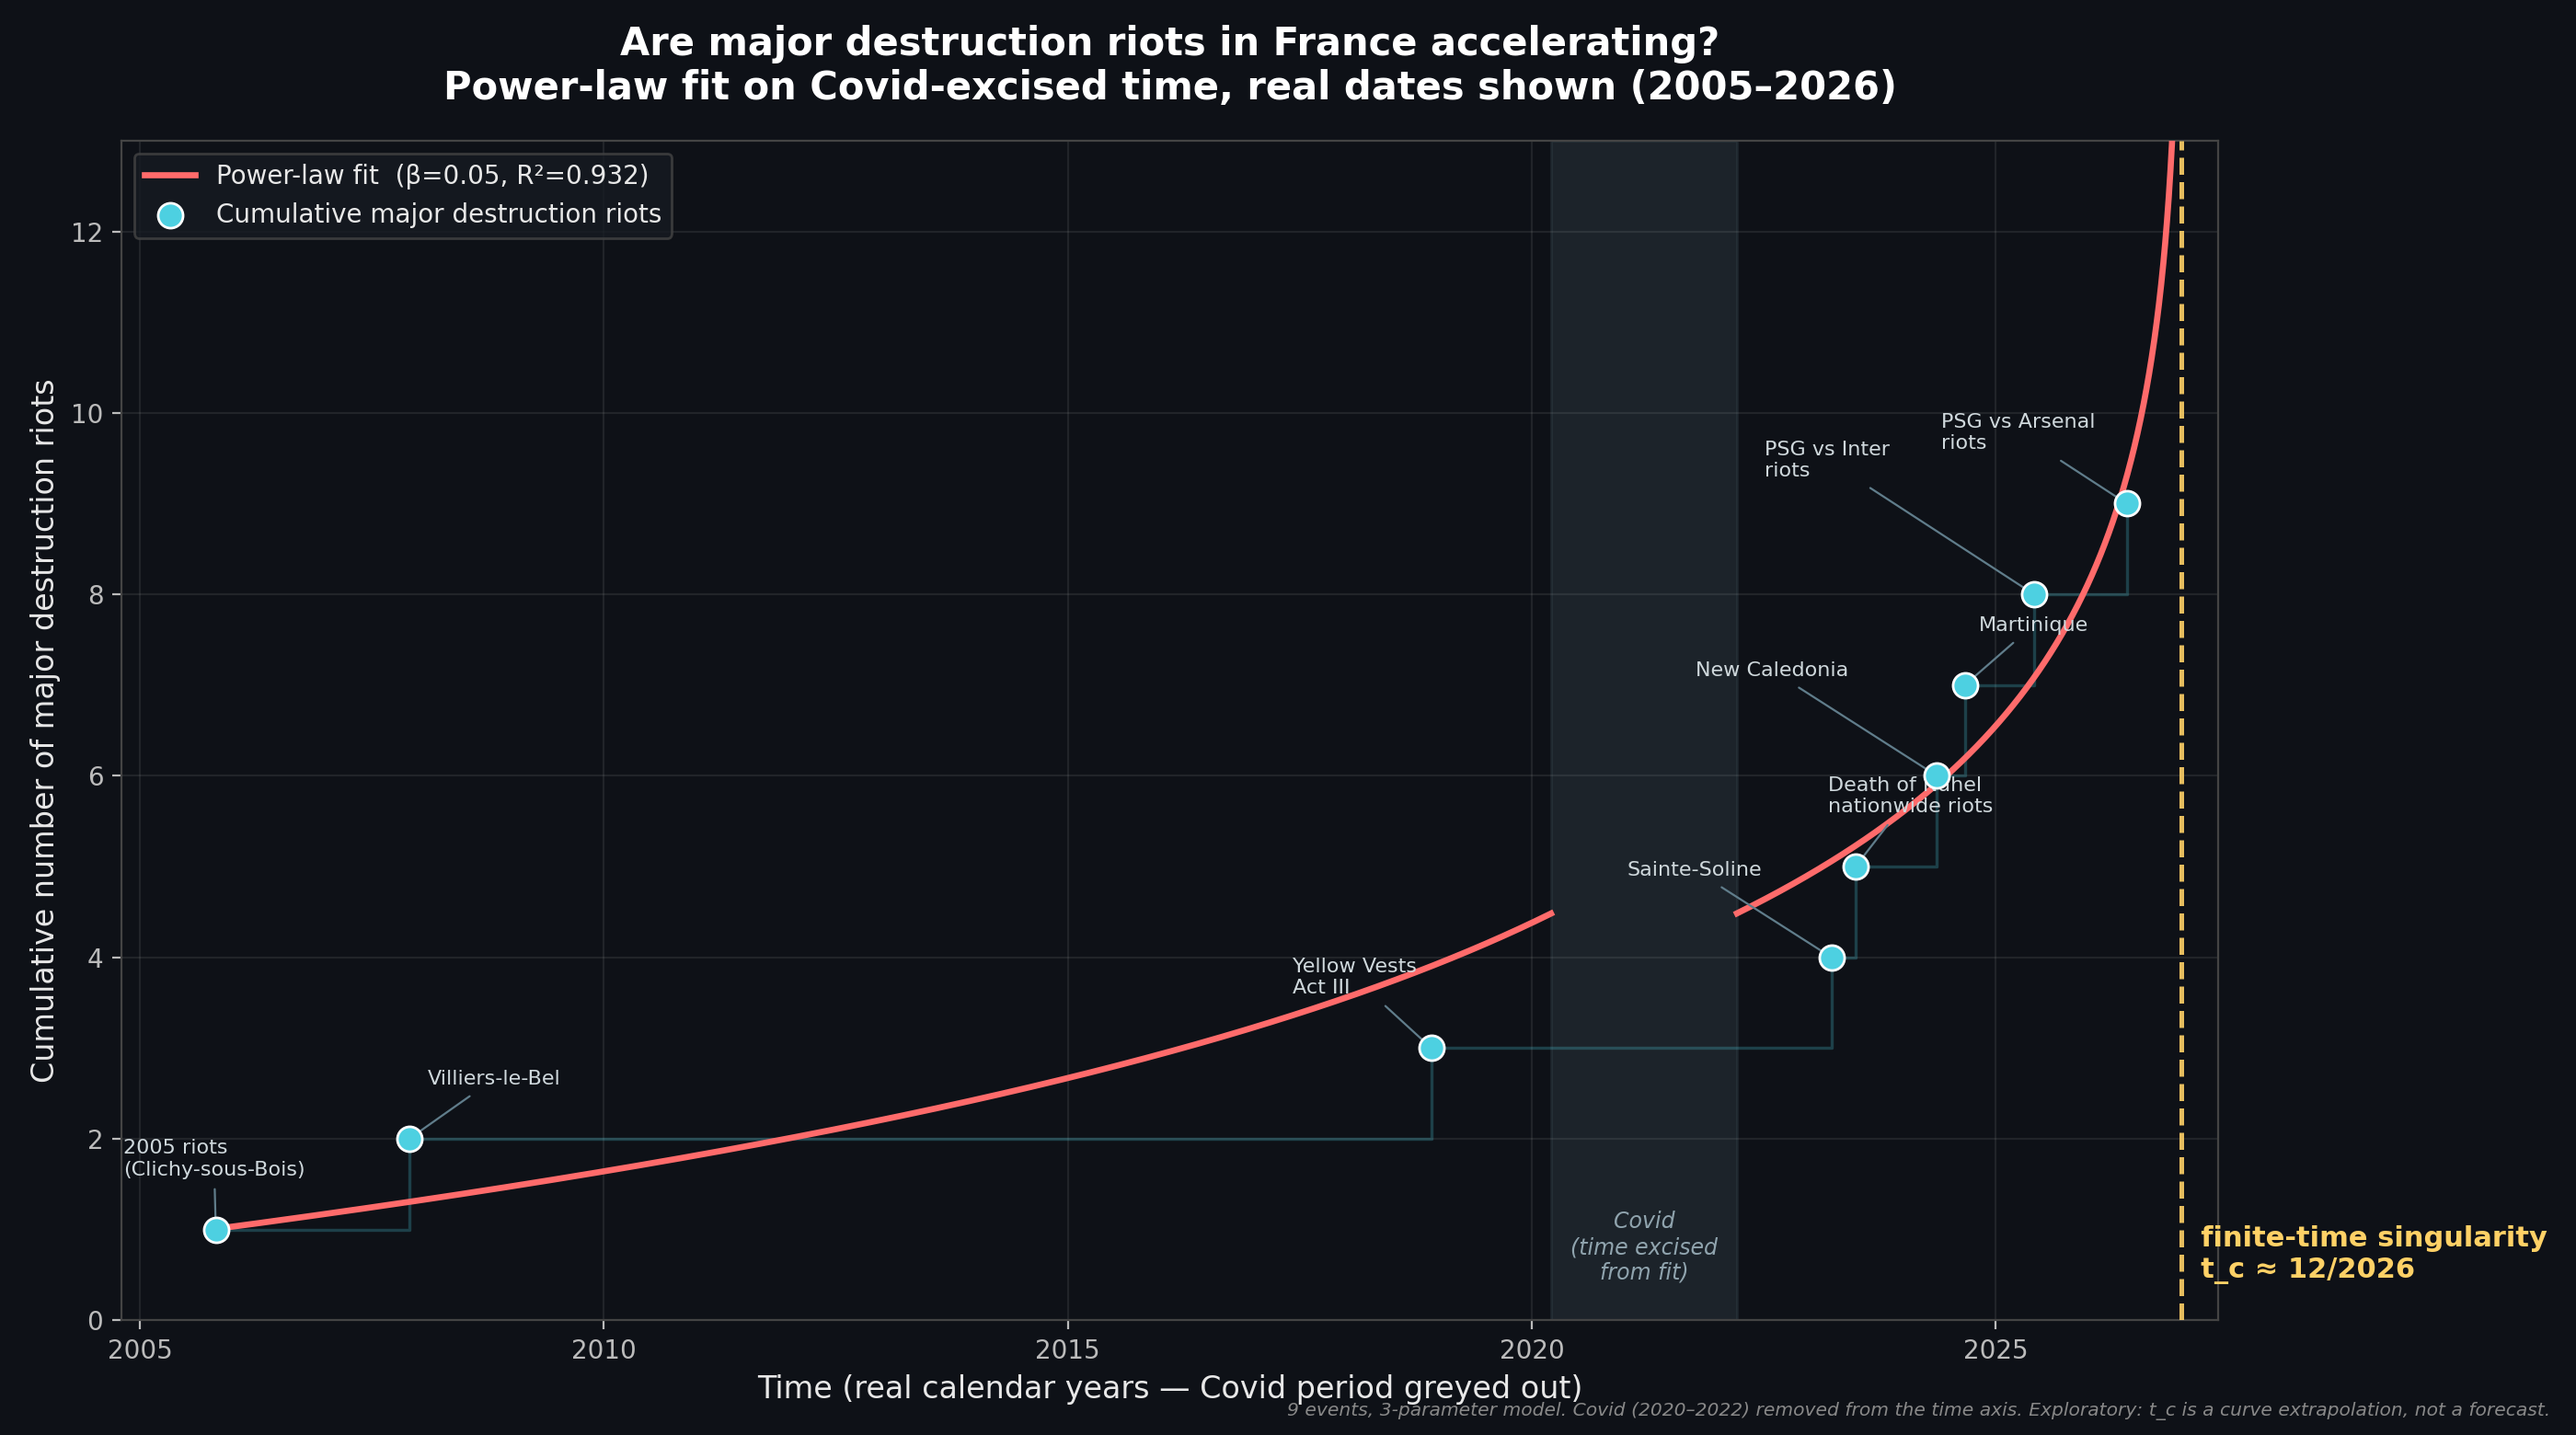
I started wondering whether the big, destructive riots in France were becoming more frequent, or whether it just felt that way because the most recent ones are fresh in memory. So I did what any curious person with too much time does: I built a dataset and fitted a curve to it.
Why a power law?
When you want to study how the frequency of events changes over time, a power law is a natural tool. A power law describes a quantity that grows as a power of another, and its defining feature is that it has no single typical scale. That makes it well suited to systems where events cluster and where the gap between events keeps shrinking, which is exactly the question here: are the intervals between major riots getting shorter?
The specific form I used models an acceleration toward a critical point in time:
y(t) = A - B * (tc - t)^beta
Here y(t) is the cumulative number of riots, tc is the critical time, and beta controls how sharply the curve bends. As t approaches tc, the curve shoots upward.
In plain terms, the model asks: if the recent clustering continued, when would the rate of riots blow up?
The data
I kept only what I would call major "destruction riots": events with large scale arson, looting, attacks on institutions, or fatalities. I deliberately excluded ordinary protests and farmer blockades, which disrupt but rarely destroy.
I removed the Covid period (roughly 2020 to 2022) from the time axis. During those two years collective life was frozen by lockdowns and curfews, with public gatherings banned. Treating that stretch as if it were normal social time would distort the trend, so I excised it. The chart shows real calendar dates, but the fit runs on this "Covid corrected" timeline.
The events, from the 2005 nationwide riots through the 2026 Champions League celebrations, give nine cumulative data points.
What the curve says
The cumulative count is flat through the late 2000s and 2010s, then bends sharply upward across 2023 to 2026, with the critical time landing around late 2026.
And this is the single most important thing to understand:
What
tcrepresents is the point where the rate of riots would theoretically become infinite, not the date of any particular riot. It is a trend extrapolation, not an event calendar.
The model does not predict that a riot will happen on a given day. It describes how a past trend has been accelerating, and it marks where that acceleration, if unbroken, would run out of room. Those are very different claims.
What the model is blind to
A power law fitted to nine points is a curiosity, not a crystal ball. Three blind spots matter here.
First, the model knows nothing about the calendar. It places tc wherever the curve fits best, with no notion of seasons. That brings us to a documented pattern the equation completely ignores.
Seasonality. Large destruction riots in France overwhelmingly erupt in the warm season. Looking at the data itself, the triggers cluster in spring and summer: the death of Nahel in late June, both PSG finals at the end of May. A critical time landing in December is therefore suspicious on its face. The natural window for a large riot to actually ignite is closer to April through September. So even if the trend points to late 2026, common sense pushes the next likely flashpoint into the warm months of 2027.
Second, the model cannot see the political and cultural calendar that any French observer can. Two events stand out.
The 2026 World Cup is very likely to produce celebration riots and looting in France, exactly the football driven pattern that already appears twice in the dataset with the PSG finals. A deep run or a win by the national team would fit the established template precisely.
The April 2027 presidential election is a second obvious source of tension. A victory by either the far left or the far right would create conditions for unrest, and the timing falls squarely in the warm season window. The model has no way to encode either of these, yet both are arguably more informative about the near future than the curve itself.
Third, a power law describes correlation, not causation. The riots in this dataset have exogenous, unpredictable triggers: a police shooting, a football result, a constitutional dispute in New Caledonia. Nothing in the equation generates those triggers. The curve catches a temporal pattern, it does not explain it, and it certainly does not cause it.
The honest takeaway
The fit suggests that major destruction riots in France have genuinely been clustering, and that the trend has been steepening since 2023. That part is in the data, not invented by the model.
But the precise critical time is fragile. Change the exponent constraint, the Covid handling, or add or drop a single event, and tc shifts by months. Read it as an order of magnitude, not a forecast: the underlying tendency is entering an unstable phase somewhere around 2026 to 2027.
If I had to bet on a window rather than trust the equation's exact date, I would point to the warm season of 2027, when the seasonal pattern, the post election period, and the steepening trend all line up. Whether that is signal or coincidence, I leave to you.
Methodology: 9 events, 3 parameter power law fitted with SciPy, multi start to avoid local minima. Covid (2020 to 2022) removed from the time axis. Exploratory work, not a prediction.